How to Reduce Inventory by 15-20% Without Risk of Stockouts
There is a way to reduce inventory by 15-20% while maintaining product availability at 99%+. The key is combining smart data analysis with demand forecasting.
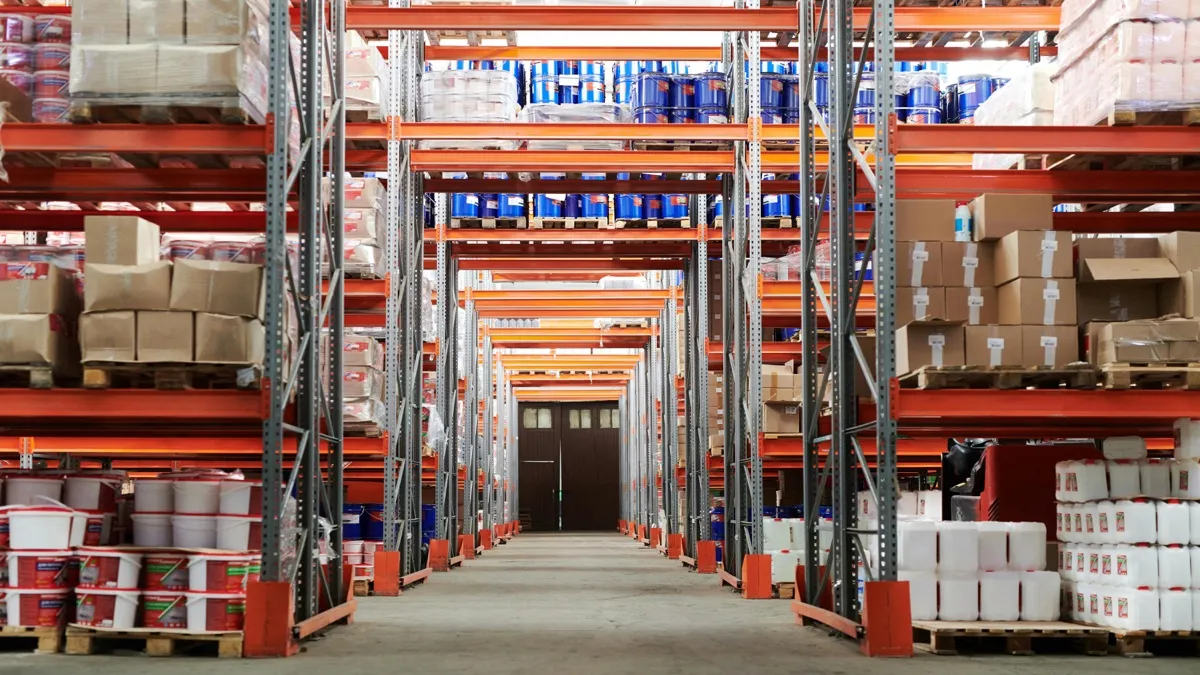
Excess inventory is, with few exceptions, a nightmare for every company, and today there’s hardly anyone not dealing with cash flow issues. Capital tied up unnecessarily in inventory cannot be invested in growth, marketing, or innovation. At the same time, aggressive inventory reduction can lead to stockouts of key products, customer loss, and reputation damage.
However, there is a way to reduce inventory by 15-20% while maintaining product availability at 99%+. The key is combining smart data analysis, demand forecasting, capturing seasonal effects, and considering all variables such as lead time, inventory turnover, or supplier reliability.
Why Companies Hold Too Much Inventory
Based on our experience from the European market, the main reasons are:
-
Fear of stockouts — Buyers prefer to order more. Common practice is to increase orders by 10-20% depending on how critical the product is to the company, just to ensure no stockouts occur. This approach leads to excess inventory and, over time, often results in dead stock.
-
Manual planning in Excel — Manual calculations based on historical averages don’t account for seasonality, promotional campaigns, trends, and often need to be connected to other data sources to include factors like goods in transit.
-
Inaccurate demand forecasts — Without advanced analytical tools, companies underestimate or overestimate future sales, leading to either shortages or overstocked warehouses.
-
Long supplier lead times — When orders take several weeks, companies maintain higher safety stock without considering whether the supplier is reliable or if their products have substitutes.
The result? A typical company with $15M revenue has $2-2.5M tied up in inventory, when optimal would be $1.2-1.5M, and stockouts still occur. That’s millions of dollars frozen in products that sell slowly or sit idle.
3 Steps to Optimize Inventory Without Risk
1. Analyze ABC Product Categories
The first step is to categorize products by their importance to revenue, profit, or sales volume:
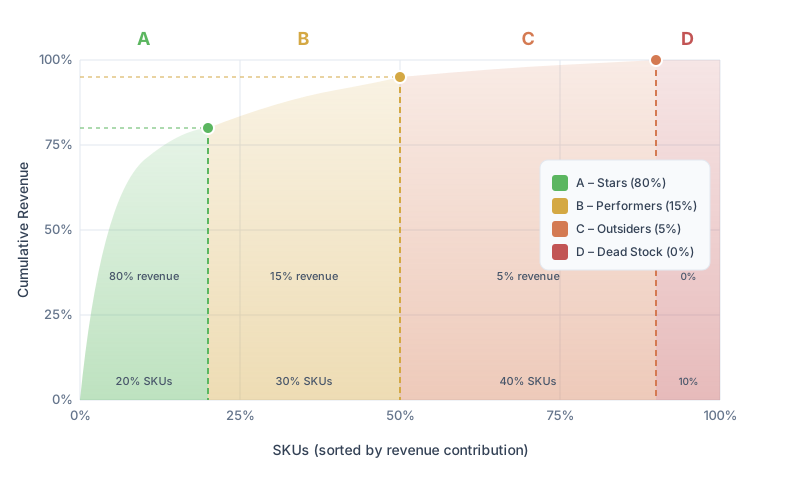
As shown in the chart, the cumulative revenue curve rises steeply for the first 20% of products and then gradually flattens. This is the classic Pareto distribution:
-
Category A (top 20% of products) — these products generate 80% of revenue. They require the most accurate forecasting and lowest risk of stockouts.
-
Category B (middle 30%) — Generate 10-15% of revenue. Here you can take slightly more risk with inventory optimization.
-
Category C (bottom 40%) — this portion of the portfolio represents only 5% of revenue. For these products, you can minimize inventory or even remove them from the offering, as they often don’t make economic sense with longer lead times.
-
Category D (tail of portfolio, 5-10%) — this category typically represents products that are no longer sellable and only take up warehouse space while draining cash flow.
Real-world example: An electronics e-shop had 5,684 SKUs. After ABC analysis, they found that 967 products (Category A) generated 78% of revenue. They focused on ensuring their availability and reduced inventory for the remaining 4,717 Category B and C products by 45%.
2. Implement Demand Forecasting
Instead of manual estimation, use predictive models that account for:
-
Seasonality — For example, Christmas peak, summer sales, Easter, or Black Friday
-
Trends — Growing or declining interest in certain products, such as with new model launches, competitor market entry, or vice versa
-
Promotional campaigns — Impact of discounts on sales volume and cannibalization of similar products in the category
-
External factors — Holidays, delivery schedules, economic changes, reduced operations, or in-house production
Modern AI systems achieve forecasting accuracy up to 95%, eliminating capital waste from poor estimates.
3. Automate Ordering
Manual order creation in Excel takes up to 20 hours per week and contains errors. Automated systems:
- Suggest optimal orders based on demand forecasts
- Respect supplier lead times and minimum order quantities, packaging, inventory turnover
- Alert you to stockout risks with sufficient advance notice
- Account for goods already on order
- Can detect sales trend changes and react quickly
How to Implement This Technologically
Implementing these three steps requires modern tools based on artificial intelligence and machine learning. Key features include:
-
AI demand forecasting — Deep learning algorithms that detect hidden patterns in historical data, self-correct for errors, always select the most accurate method, and do it daily
-
Automatic order suggestions — The system suggests how much and when to order, and after approval, exports the order to your ERP
-
Reporting and dashboards — Solutions typically include real-time overview of inventory, sales, and availability
Typical benefit: Save 20 hours weekly + reduce inventory by 10-15% + increase revenue by 5% through better product availability and elimination of lost profits from stockouts.
Conclusion
Inventory optimization isn’t about risky reduction—it’s about smart data analysis and process automation. Companies that combine ABC analysis, demand forecasting, and order automation achieve:
- Significant inventory reduction, often up to 20%
- 99%+ product availability
- Up to 20 hours saved weekly
- 2-5% revenue increase
Want to see how it works in practice?
Check out www.goodstock.ai — an AI solution for demand forecasting and inventory management automation that helps retail, e-commerce, and wholesale companies optimize their inventory without risk, all in one place.