Free Up Capital While Maintaining Availability
GOODSTOCK.AI analyzes demand patterns and variability to find the optimal balance between inventory and service levels. No more guessing, no more overstocking.
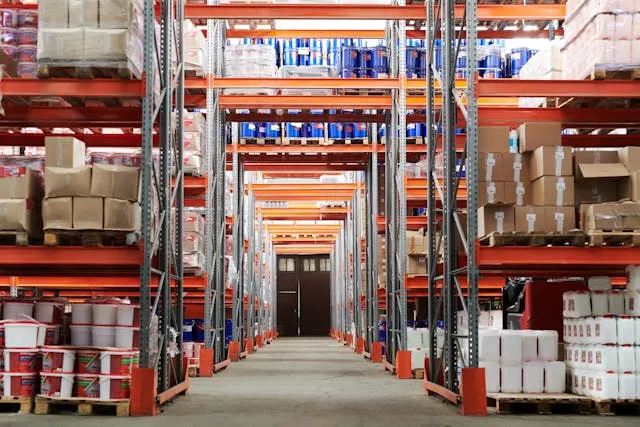
Sample data
Stock Optimization Effects
Inventory reduction
Product availability
Working capital freed
Sample data
Find the Right Balance
Too much inventory ties up capital and increases costs. Too little means lost sales and unhappy customers. GOODSTOCK.AI finds the optimal level for every product.
AI analyzes demand variability, lead times, and your service targets to calculate optimal levels
Sample data
Portfolio Segmentation
ABC analysis automatically classifies your products by revenue contribution and demand predictability. Top performers get premium service levels, while slow-movers are managed for efficiency – ensuring you invest where it matters most.
Different products, different strategies. Set optimal service levels and safety stock targets for each segment automatically.
Dynamic Safety Stock
Static safety stock wastes capital in quiet periods and fails you during peaks. Our AI calculates optimal safety levels for each product based on demand variability, lead times, and seasonality – automatically adjusting before high-demand periods.
Safety stock increases automatically before seasonal peaks and reduces during stable periods – maximizing availability while minimizing tied-up capital.
Sample data
What You Get
ABC Classification
Automatic product classification by revenue and demand predictability. Focus attention on items that matter most.
Optimal Safety Stock
AI calculates the right safety stock for each product based on demand variability, lead times, and your service level targets.
Dead Stock Detection
Identify products that haven’t sold in months. Get recommendations to liquidate or discontinue before they drain resources.
Slow-Mover Analysis
Spot products with declining velocity. Decide to promote, reduce stock, or phase out based on data.
Inventory Redistribution
Transfer excess stock between locations. AI identifies where products are needed most based on local demand.
Stock Level Targets
Set and track optimal min/max levels. Get alerts when stock deviates from targets.
Ready to Optimize Your Inventory?
Book a demo and see the results on your own data.